In this article i will show the core part of this simple dockerized flask app used for showing a regression plot image.
At first we should create a Dockerfile that uses a requirements file to install all needed dependencies:
matplotlib==3.3.0
seaborn==0.10.1
pandas==1.0.5
flask==2.1.0
Now let’s see the Dockerfile:
FROM python:3.8

COPY ./requirements.txt /requirements.txt

WORKDIR /

RUN pip3 install -r requirements.txt

COPY . /

EXPOSE 5000

ENTRYPOINT ["python3"]

CMD [ "app/app.py" ]
We are ready to setup flask and create the app.py file and the plotdata.py file used to plot the image
# app.py
from flask import Flask, send_file
from plotdata import regression_plot

app = Flask(__name__)

@app.route('/', methods=['GET'])
def regr_plot():
    image = regression_plot()

    return send_file(image,
                     attachment_filename='regplot.png',
                     mimetype='image/png')

if __name__ == '__main__':
    app.run(host='0.0.0.0', debug=False)
#plotdata.py
import pandas as pd
import matplotlib
import seaborn as sns
import io

if __name__ =='__main__':
    from PIL import Image

matplotlib.use('agg')

def regression_plot():
    df = pd.read_csv('tempYearly.csv')

    sns_plot = sns.regplot(x='Rainfall', y='Temperature', data=df)

    image = io.BytesIO()

    sns_plot.figure.savefig(image, format='png')

    image.seek(0)
    return image

if __name__ == '__main__':
    image = regression_plot()
    im = Image.open(image)
    im.save('regress.png')
Finally we need to build the image using this command:
docker build --tag flask-plotting-app .
then running the container:
docker run -it --name flaskpltapp -p 5000:5000 flask-plotting-app:latest
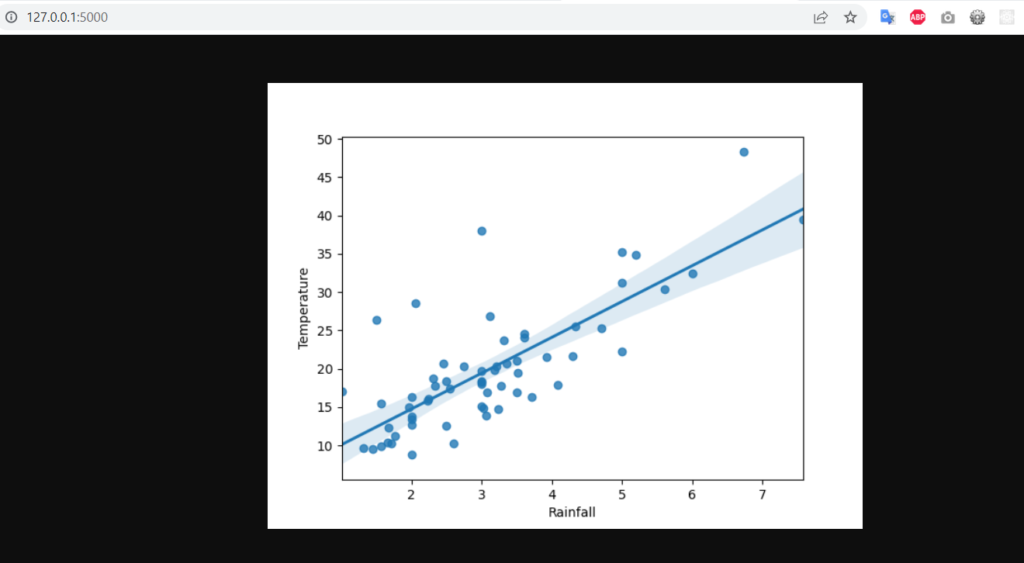
This is the final result
This is the repository link of this project: Dockerized Flask regression app